TRADE IDEA: What's Next for Yen Crosses?

TRADE IDEA: What's Next for Yen Crosses?

2022-11-30 • Updated

AUDJPY

AUDJPYH4-2511.png

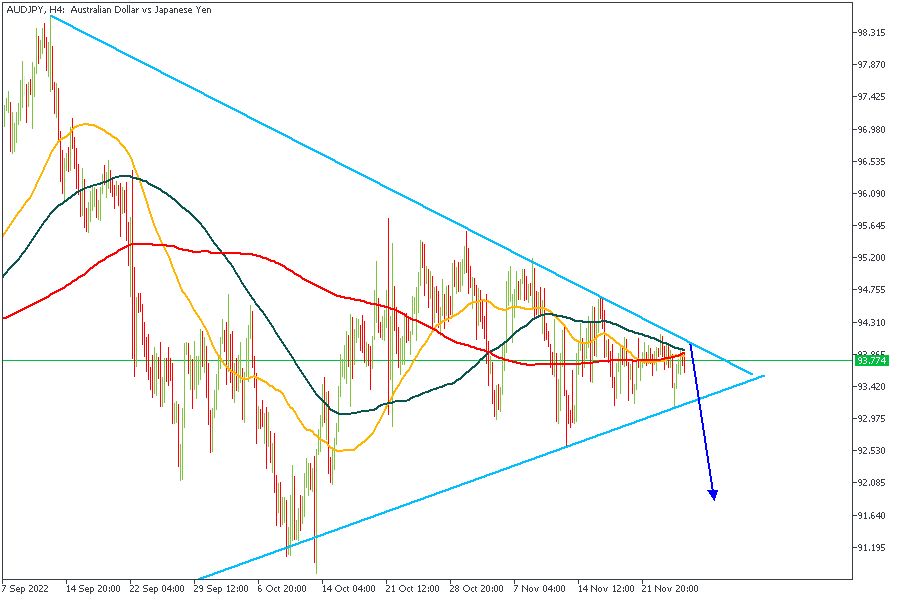
The wedge scenario on AUDJPY is such that the upper trendline dates as far back as September, whilst the trendline support dates even farther. As a result, the trendline with the most touches is naturally expected to be the weaker one, and thus, my bias for a bearish breakout. The real impulse is expected to begin after the breakout of the wedge.

CADJPY

CADJPYDaily-2611.png

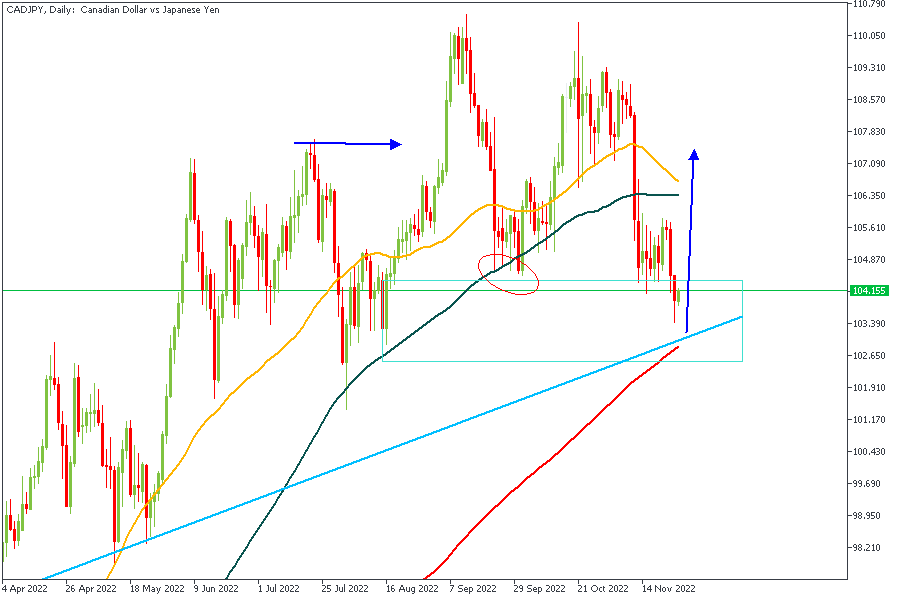
After the bullish break of structure that occurred at the horizontal blue arrow, we can see that price retraced lower and liquidity was taken out at the circled region. Based on these schematics from an SMC (Smart Money Concept) point-of-view) the area between 104.5 and 102.0 is expected to act as a drop-base-rally demand zone. Coupled with the trendline support, 200-day Moving Average, and the 88.2% Fibonacci retracement zone, I am expecting a bullish reaction from the marked zone, possibly to the 107 area.

EURJPY

EURJPYH4-2511.png

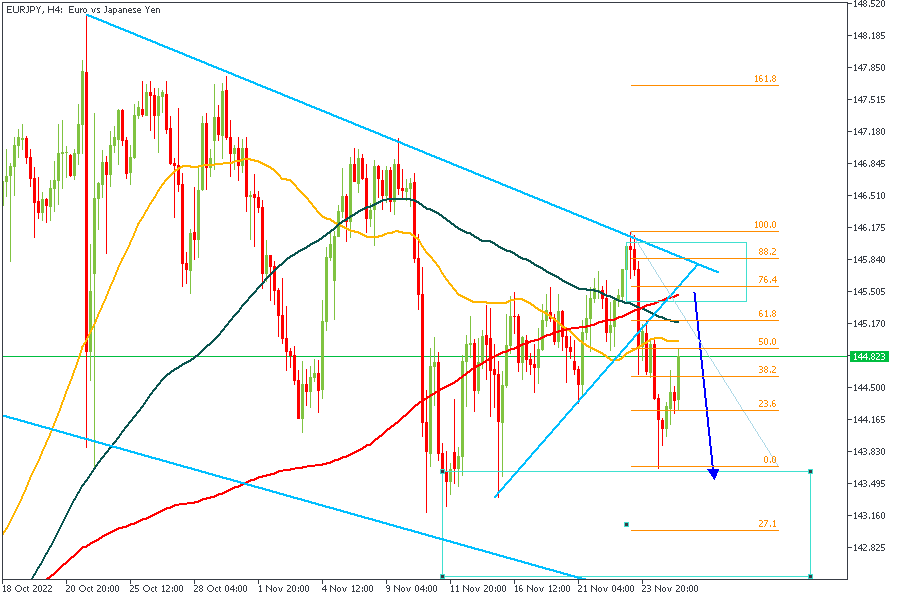
EURJPY can be seen trading within this huge wedge with a recent bearish break of structure as well as a break of the internal trendline. Based on these factors, the current bullish impulse can be considered a retracement. The marked rectangular zone at the 76.4% retracement level is my expected area of interest since a confluence of other important factors like the 200-SMA, 50-SMA, and internal trendline retest all align around the area.

GBPJPY

GBPJPYH4-2511.png

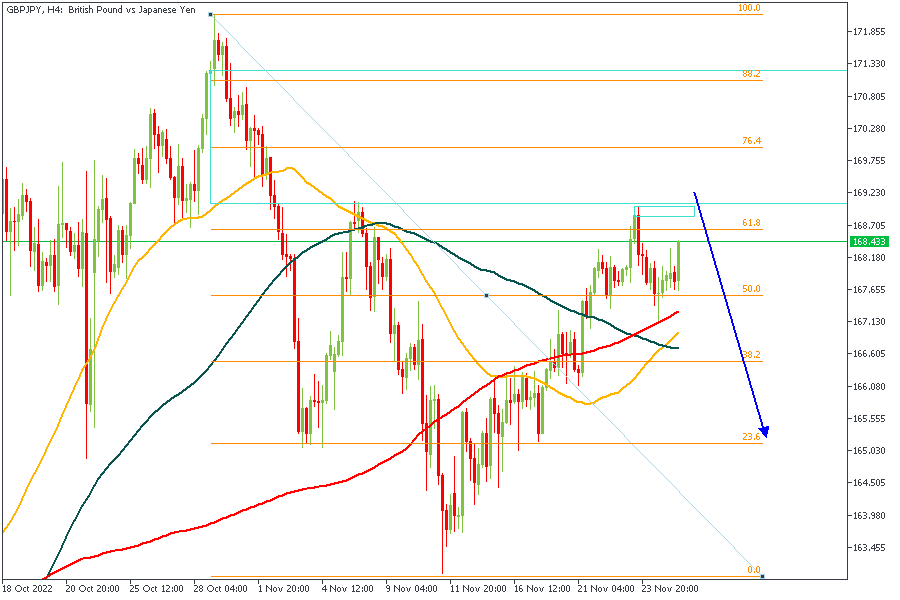
GBPJPY is currently approaching a major supply zone as spotted on the Daily timeframe. There is a possibility of a temporary bullish impulse in the meantime in order to clear out liquidity from the equal highs. We can therefore expect to see a bearish continuation from the 76.4% retracement area.

NZDJPY

NZDJPYDaily-2511.png

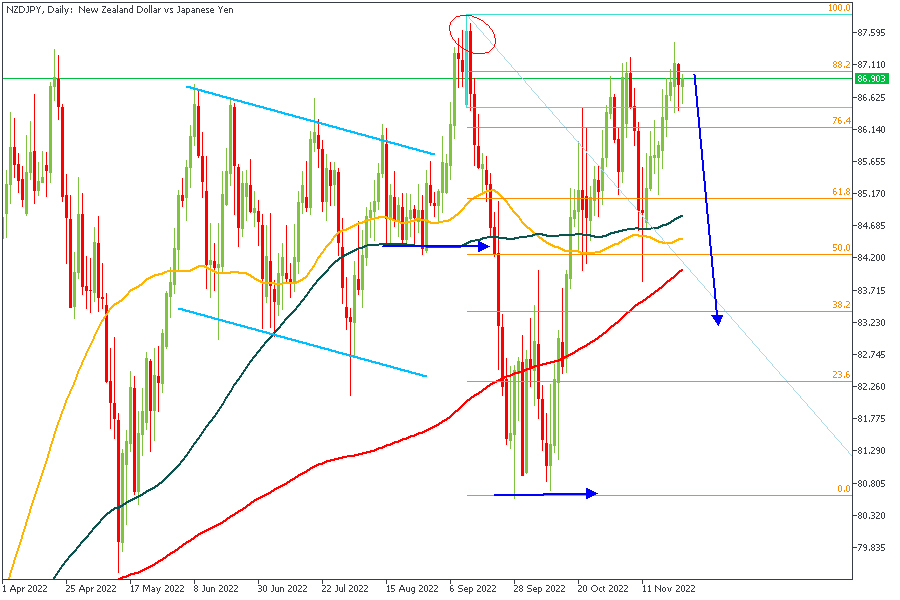
NZDJPY seems to be seeking to complete the AMD (Accumulation-Manipulation-Distribution) schematic which means we can expect a bearish impulse from within the current rally-base-drop supply zone to move toward the 200-MA.

USDJPY

USDJPYDaily-2511.png

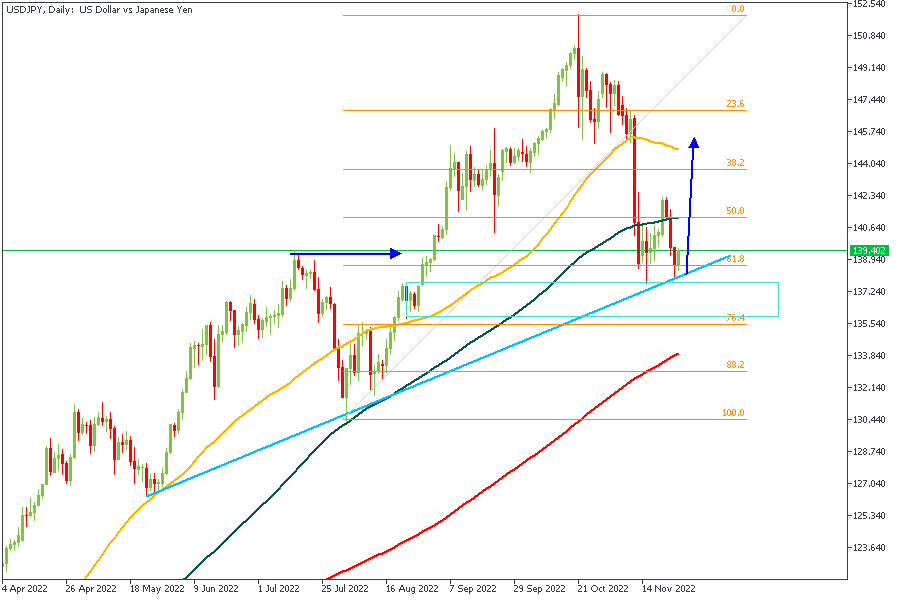
The previous break of structure on USDJPY as seen from the horizontal blue arrow on the chart above is bullish. Right now we're seeing a retest of the rally-base-rally demand zone that aligns perfectly with the trendline support and the 61.8% retracement level. This means that we can expect to see some bullish impulse from USDJPY going into the new week.

CONCLUSION

The views above are solely based on Technical Analysis techniques using my personal Smart Money approach. Hence, it is important to understand that the trading of CFDs comes at a risk; if not properly managed, you may lose all of your trading capital. To avoid costly mistakes while you look to trade these opportunities, be sure to do your own due diligence and manage your risk appropriately.

Log into your dashboard or create an account here to get started.

Similar

CAD: Markets Await GDP Release

During the Asian session on Wednesday, the USD/CAD pair rebounded after two days of losses, reaching around 1.3590. This uptick is fueled by a stronger US dollar and lower crude oil prices, which put pressure on the Canadian dollar. The decline in Western Texas Intermediate (WTI) oil prices to approximately $80.70 is attributed to...

Trade of The Week: AUDNZD Trade Breakdown

The Australian Dollar (AUD) rebounds on Monday, despite a slight dip in the US Dollar (USD) and higher US Treasury yields. Investors are eyeing Australian monthly Consumer Price Index (CPI) data for February and US Gross Domestic Product (GDP) for Q4 2023. The AUD gains momentum as the ASX 200 Index rises, especially in mining and energy sectors. Additionally, the Aussie...

XAUUSD: Markets Slow Down Ahead of NFP

Gold prices rose on Monday as the US Dollar weakened amidst speculation about potential Federal Reserve rate cuts starting in June. This weakened Dollar was partly due to improved risk sentiment pushing US Treasury yields lower. Despite facing challenges from declining yields, gold prices recovered to nearly $2,170 per troy ounce, driven by the Dollar's weakness. Federal Reserve Chair...

Latest news

USD: Powell Speaks on Cutting Interest Rates

Jerome H. Powell, the Federal Reserve chair, stated that the central bank can afford to be patient in deciding when to cut interest rates, citing easing inflation and stable economic growth. Powell emphasized the Fed's independence from political influences, particularly relevant as the election season nears. The Fed had raised interest rates to 5.3 ...

WTT: Currency Pairs To Trade In April

Hello again my friends, it’s time for another episode of “What to Trade,” this time, for the month of April. As usual, I present to you some of my most anticipated trade ideas for the month of April, according to my technical analysis style. I therefore encourage you to do your due diligence, as always, and manage your risks appropriately.

Deposit with your local payment systems

Data collection notice

FBS maintains a record of your data to run this website. By pressing the “Accept” button, you agree to our Privacy policy.

Callback

A manager will call you shortly.

Change number

Your request is accepted.

A manager will call you shortly.

Next callback request for this phone number
will be available in

If you have an urgent issue please contact us via
Live chat

Internal error. Please try again later

Don’t waste your time – keep track of how NFP affects the US dollar and profit!

You are using an older version of your browser.

Update it to the latest version or try another one for a safer, more comfortable and productive trading experience.

Safari Chrome Firefox Opera